- About us
-
Product
- Services
- Download
- Press center
- Contacts
TIK-RVM extended monitoring system for GPU
Upper level - diagnostics expert's AWP / Operator's AWP
At the upper level of the system, there is an industrial workstation with installed SCADA-package and special-purpose modules (diagnostics expert's AWP).
Main screens of the system:
- General mnemonic diagram of the system;
- Mnemonic diagram of the unit;
- Mnemonic diagram of instrumentation;
- Reports;
- Trends;
- Event log;
- Bar charts;
- Review of samples;
- System configurator.
General mnemonic diagram of the system
The main mnemonic diagram shows the current state of all units in the shop. When warning or alarm events occur, the indication having several degrees of priority, depending on nature of the fault, appears on the diagram.

When the color indication appears on the general mnemonic diagram, the window with the list of detected defects can be called up. Further recommendations for elimination of the detected defects are displayed in this window too.

The expert system detects the following equipment faults automatically:
- Loosening (defect of fixing);
- Damage of fastening to the foundation and connecting structures (rotor's self-oscillation);
- Defect of coupling;
- Misalignment of shafts;
- Surging and pre-surging condition;
- Stream nonuniformity, stall;
- Hydraulic shock;
- Cavitation;
- Impeller imbalance;
- Defect of blades;
- Defects of the stator;
- Defects of the rotor, rotor runout;
- Phase imbalance (nonlinearity of voltage);
- Rotor imbalance;
- Defects of bearing;
- Misalignment of bearing;
- etc.
The bottom part of mnemonic diagram contains navigation buttons. Current state of the unit assemblies, measured parameter values (vibration, temperature, pressure, etc.), and the general operating time are displayed on the mnemonic diagram. Performance indicators that allow to visually determine the time left before the scheduled, medium and major repair are displayed on the mnemonic diagram. Defective assemblies are marked with icons having various colors, depending on nature of the defect.

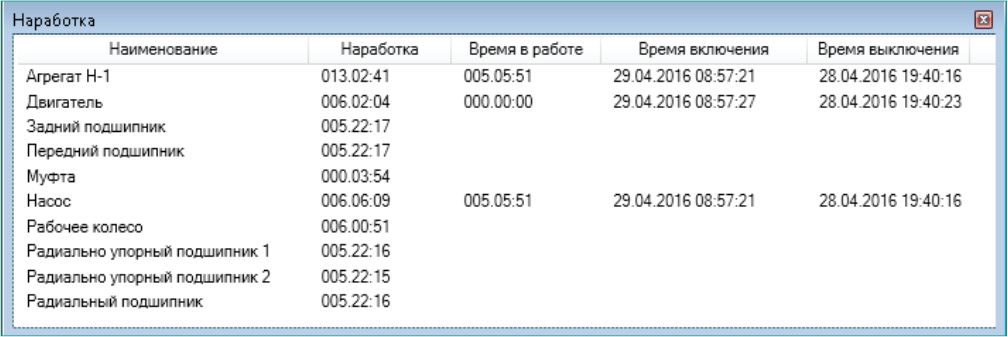
The progress window for all assemblies appears after pressing "Total operating time".
Event log
The event log describes all events that have occurred with the system. Operator's interface allows sorting the log by various features for easier finding the necessary event.

Reports
The software generates reports in graphical, text, or mixed form automatically.

Recommend to watch
New products
 TIK-WST temperature transducer
  TIK-WSV vibration meter
  New product!


- Certified Laboratory of non-Destructive Testing in the field of vibrodiagnostics and visual-measuring control (VD and VMC)
- Training Center for training and advanced training of technical specialists
- Full production cycle from preparation to finished product
- Certified Metrological Service
- Complete Service Center